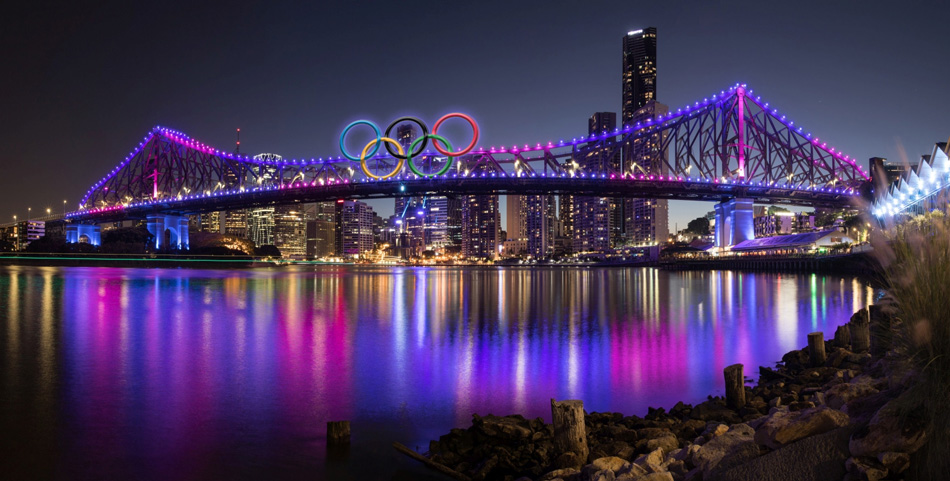
Brisbane’s Top 10 valuation hit parade
We’ve compiled the VG’s latest Top 10 – the Valuer-General’s ‘hit parade’ – showing the Brisbane suburbs hit (king hit!) with the biggest hikes in Statutory Land Valuations. One riverside pocket stands out as being over-represented.
While the median value increase across Brisbane was about 11%, the peninsula encompassing Chelmer, Graceville, Sherwood and Corinda has been hit with suburb median site value rises of up to 37%.
We can’t understand why these suburbs have taken four spots on the VG’s Top 10 hit list. But it has major implications for on-going costs, including rates and land tax. Could it be a revenue grab?
Be warned, the deadline for objections is only days away.
Where is the justification?
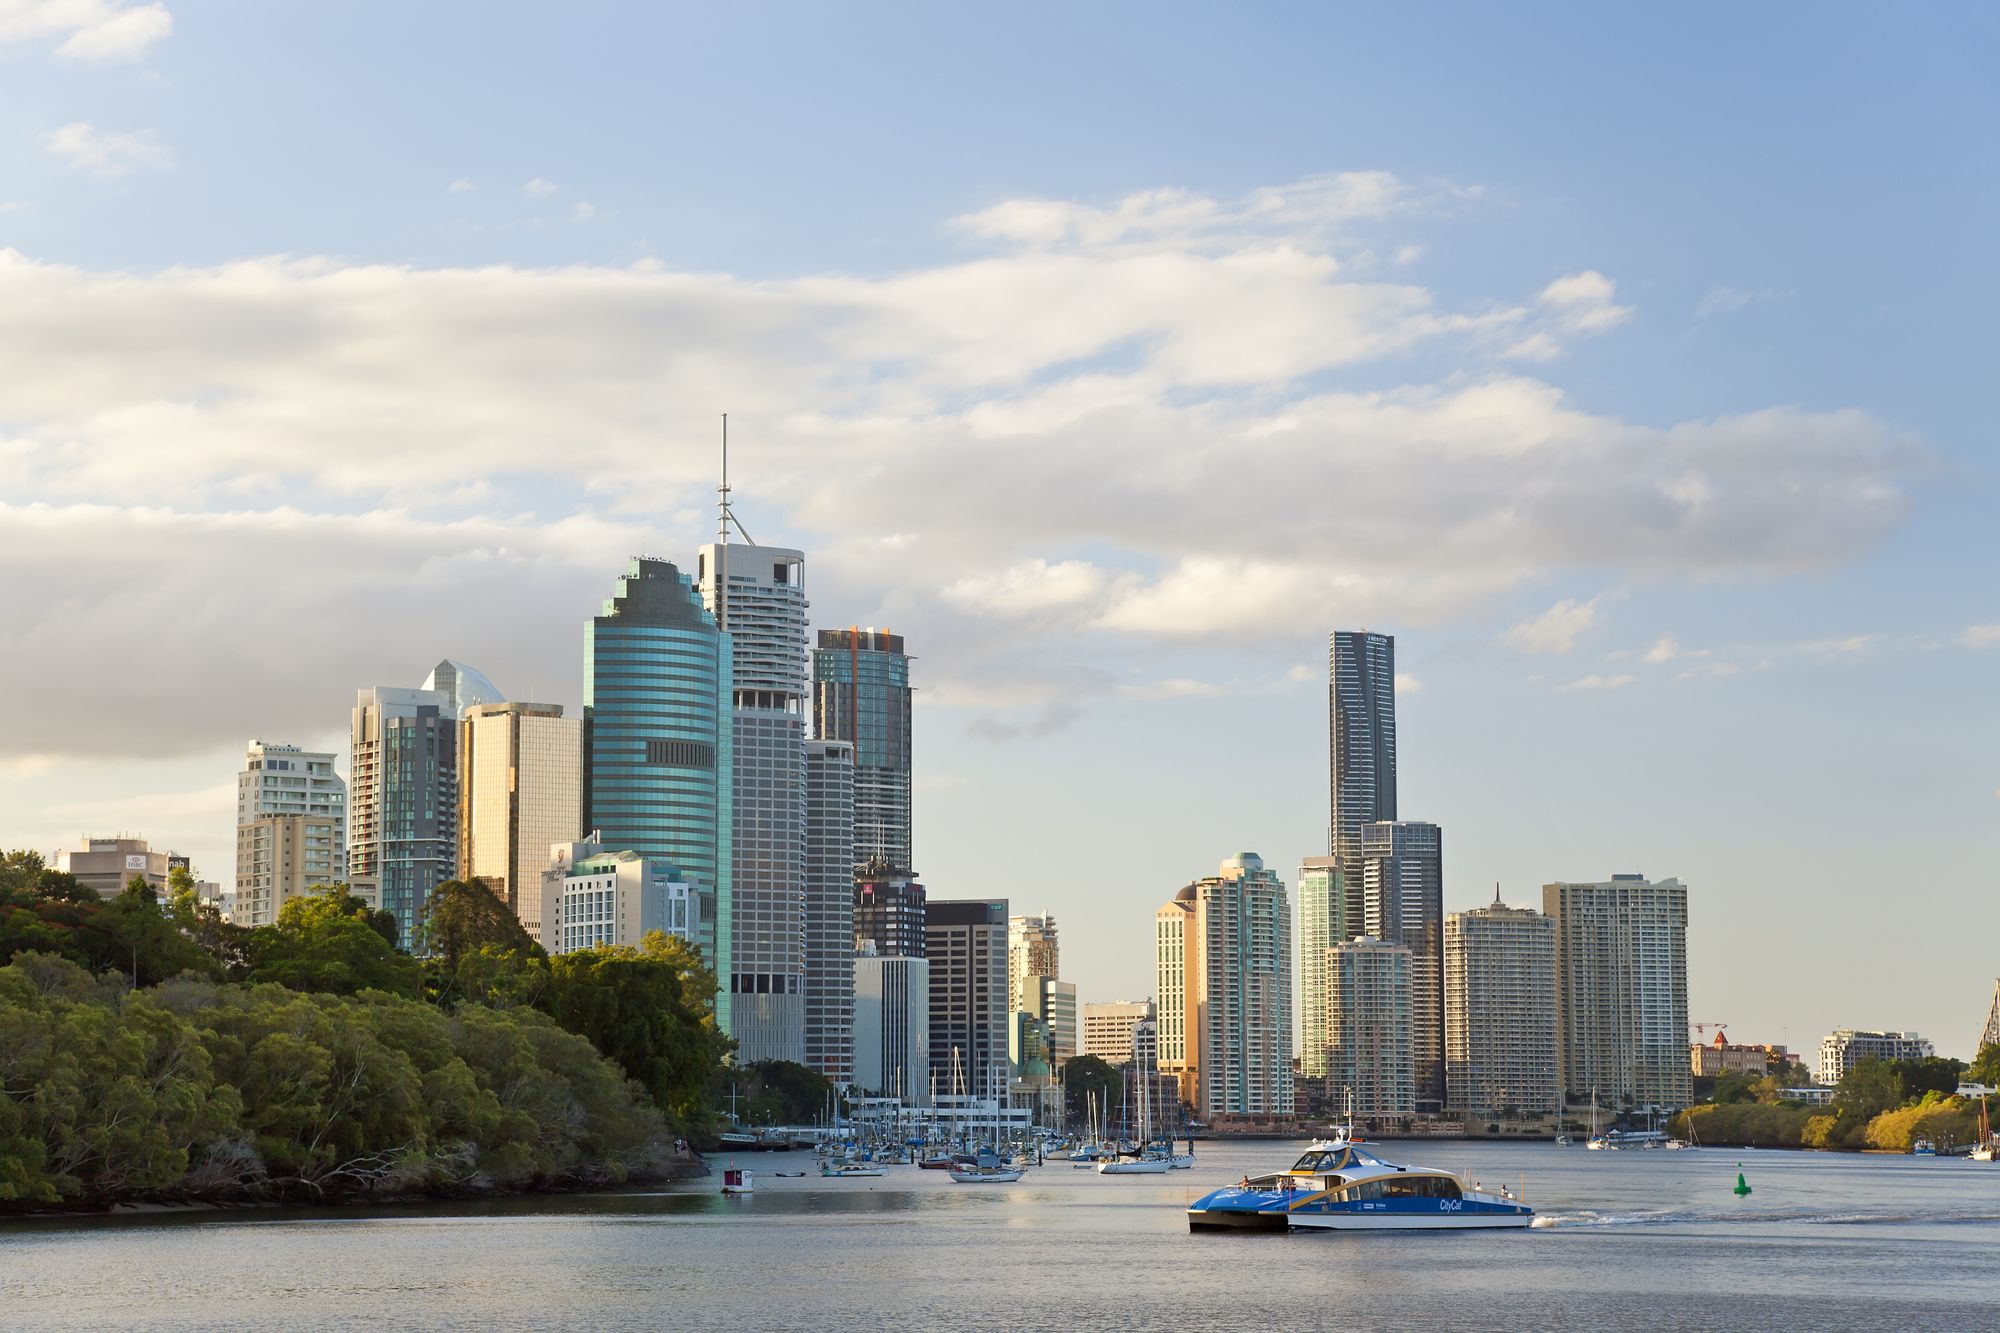
Brisbane City Council area comprises 334,095 properties with a total approximate value of $174 billion. The 2015 valuations, which reflect site values on 1 October 2014, deemed our city’s land value to have lifted by 9.7 % overall, compared to the valuation issued in 2014.
Most suburbs recorded median land value increases of somewhere between 5% and 15%. But, if you live in the riverside suburbs flanking Oxley Road, your latest site valuation notice delivered a much bigger a shock.
Graceville came in at No.2 on the city’s Top 10 biggest hike list, showing a suburb median increase of 37% (from $380,000 to $520,000). It was closely followed by Sherwood, which lifted 36% from $420,000 to $570,000, and Chelmer, up 33% from $450,000 to $600,000 – the third and fourth highest increases.
Corinda wasn’t far behind (No.7 on the list), with its median value rising a hefty 26%, from $350,000 to $440,000. (Our full Top 10 list appears at the end of this commentary).
With prices growth for prestige and riverfront property subdued over the past 12 months, two questions need to be asked. What sales evidence has been used to justify these increases? And, are these increases reasonable in the current economic climate?
VG Neil Bray says, “There was strong interest in land near the Brisbane River, including land impacted by riverine flooding in 2011, (which) has resulted in moderate to large increases in site values in those areas.”
We say, while we understand site values (unimproved values, as they used to be called) in these suburbs dropped significantly after the 2011 floods, in many cases, they’ve now shot back above 2010 values. How can that be justified?
We know of two Chelmer riverfront properties, both flood-affected, that have copped increases of around 45% – one from $1.1 million to $1.6 million, and the other from $1.87 million to $2.7 million. A hike of 45% in one year seems beyond the pale and, in our experience, certainly doesn’t reflect the market reality.
For owners, the potential cost implications are horrendous. We ran the government’s Land Tax Estimator over these two examples (based on a property being held by a company or trust, with no exemption applied).
In the first instance, the $500,000 (45%) leap in valuation will translate to a massive 60% increase in land tax (from $14,200 to $22,700 p.a.). Land tax liability for the second property will be 48% higher (up to $40,500 p.a. from $27,290). Certainly sounds like a handy bit of revenue-raising to us!
Your official site valuation is one of the factors used by Brisbane City Council to determine rates. So surging valuations in these suburbs are also likely to signal higher landholding costs for all property owners.
Other similarly desirable suburbs have seen far more modest median valuation rises – New Farm 13%, Paddington 12%, Bulimba 11%, for example. The suburbs directly across the river from Chelmer-Graceville haven’t been hit with big rises either – Indooroopilly 12% and Fig Tree Pocket just 5%.
Indeed, even riverside suburbs immediately adjoining the Chelmer peninsula didn’t lift by anything like their neighbours, with Tennyson boosted by only 5%.
Landowners who believe their valuation is unfair or incorrect should lodge an objection (including information to support their argument) online by Monday 4 May at:
http://www.qld.gov.au/environment/land/title/valuation/lodge-objections/
TOP 10 ANNUAL VALUATION INCREASES BY SUBURB
| Rank | Suburb | Rise | Current Median | New Median |
| 1 | Macgregor | 40% | $315,000 | $440,000 |
| 2 | Graceville | 37% | $380,000 | $520,000 |
| 3 | Sherwood | 36% | $420,000 | $570,000 |
| 4 | Chelmer | 33% | $450,000 | $600,000 |
| 5 | Parkinson | 31% | $275,000 | $360,000 |
| 6 | Rocklea | 30% | $146,000 | $190,000 |
| 7 | Corinda | 26% | $350,000 | $440,000 |
| Runcorn | 26% | $270,000 | $340,000 | |
| Stafford Heights | 26% | $310,000 | $390,000 | |
| 8 | Algester | 25% | $260,000 | $325,000 |
| Kangaroo Point | 25% | $425,000 | $530,000 | |
| 9 | Ashgrove | 24% | $450,000 | $560,000 |
| 10 | McDowall | 20% | $200,000 | $360,000 |
| Sunnybank Hills | 20% | $295,000 | $355,000 |